Blog
Heatmaps & User Behavior Analysis Guide
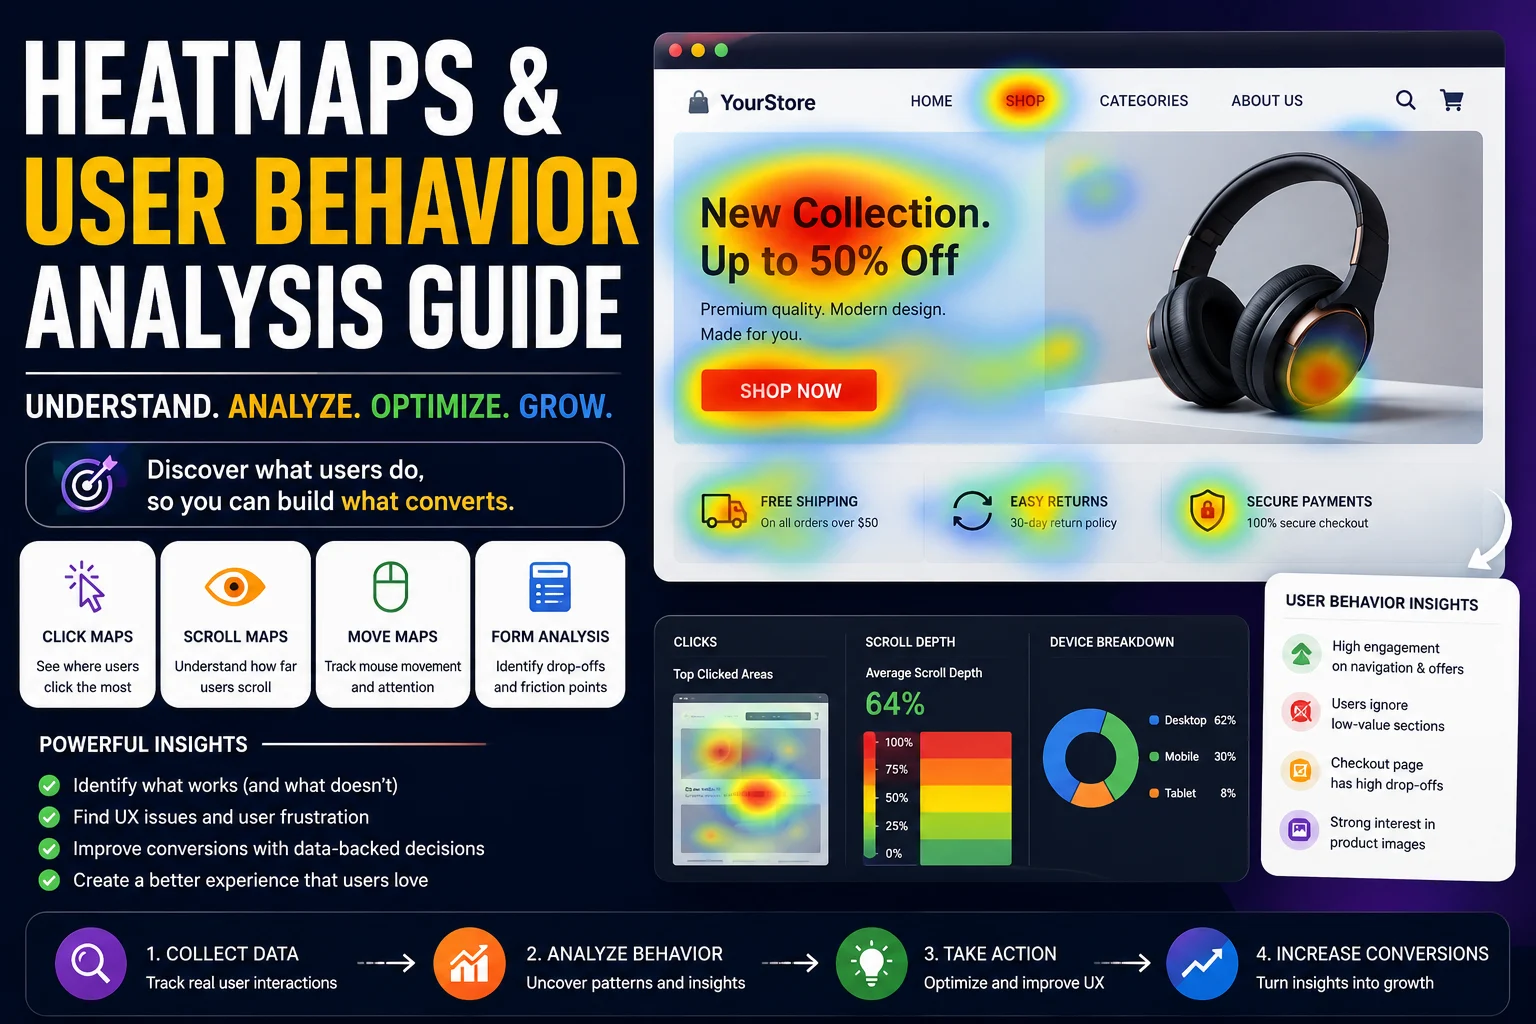
The Complete Ecommerce and Website Optimization Handbook
Introduction
Understanding how users interact with websites is one of the most important aspects of digital marketing, user experience design, ecommerce optimization, and conversion rate improvement. Businesses invest heavily in website design, SEO, advertising campaigns, landing pages, and content marketing, but without understanding actual user behavior, many optimization decisions are based on assumptions rather than data.
Heatmaps and user behavior analysis tools help businesses visualize how visitors interact with websites in real time. Instead of relying only on traditional analytics metrics such as bounce rates and page views, heatmaps reveal where users click, scroll, hover, engage, and abandon pages. These insights help businesses identify usability issues, improve conversion funnels, optimize landing pages, and create better digital experiences.
Modern ecommerce stores, SaaS platforms, blogs, corporate websites, and service-based businesses increasingly depend on behavioral analytics to improve customer journeys. By understanding how users navigate websites, businesses can reduce friction, improve engagement, and increase conversions.
According to research from platforms like Hotjar, Crazy Egg, Microsoft Clarity, and Nielsen Norman Group, user behavior analysis helps businesses uncover hidden usability problems that traditional analytics often fail to detect.
Official Resources:
- https://www.hotjar.com/
- https://clarity.microsoft.com/
- https://www.crazyegg.com/
- https://www.nngroup.com/
This comprehensive guide explains everything businesses need to know about heatmaps and user behavior analysis, including types of heatmaps, session recordings, click tracking, scroll analysis, conversion optimization, UX improvements, ecommerce applications, SEO implications, tools, testing strategies, and best practices.
What Are Heatmaps?
Understanding Heatmaps
Heatmaps are visual representations of user interactions on a webpage. They use color-coded overlays to show how visitors engage with website elements.
Typically:
- Warm colors such as red, orange, and yellow indicate high interaction.
- Cool colors such as blue and green indicate lower interaction.
Heatmaps help businesses quickly identify:
- Popular page sections
- Frequently clicked elements
- Ignored content areas
- User engagement patterns
- Conversion barriers
Rather than analyzing large spreadsheets of behavioral data, heatmaps present information visually, making it easier to understand user activity.
Why Heatmaps Matter
Traditional analytics platforms like Google Analytics provide valuable metrics, but they often fail to explain why users behave a certain way.
For example:
- A high bounce rate indicates users leave quickly.
- Heatmaps reveal where users stopped engaging.
Heatmaps provide context behind user actions.
Businesses use heatmaps to:
- Improve user experience
- Increase conversions
- Optimize landing pages
- Refine navigation
- Improve content placement
- Reduce friction
- Increase ecommerce sales
Types of Heatmaps
Click Heatmaps
What Are Click Heatmaps?
Click heatmaps track where users click on a webpage.
These heatmaps help businesses understand:
- Which buttons attract attention
- Which links users prefer
- Which elements users ignore
- Whether users click non-clickable elements
Why Click Heatmaps Matter
Click patterns reveal user intent.
For example:
- If users repeatedly click images expecting zoom functionality, businesses may need to add interactive features.
- If important CTAs receive little attention, design adjustments may be necessary.
Ecommerce Applications
Ecommerce stores use click heatmaps to analyze:
- Add-to-cart button engagement
- Product image interactions
- Navigation menu usage
- Filter selections
- Checkout interactions
Scroll Heatmaps
What Are Scroll Heatmaps?
Scroll heatmaps show how far users scroll down webpages.
They reveal:
- Content visibility
- Engagement depth
- Drop-off points
Why Scroll Analysis Is Important
Many businesses place important information too far down pages.
Scroll heatmaps help determine whether users see:
- CTAs
- Product information
- Testimonials
- Pricing details
- Signup forms
Improving Content Placement
If users stop scrolling before reaching key content, businesses can:
- Move important sections higher
- Simplify layouts
- Reduce unnecessary content
Hover Heatmaps
What Are Hover Heatmaps?
Hover heatmaps track cursor movements.
They indicate:
- Areas attracting user attention
- Reading patterns
- Engagement interest
Limitations of Hover Tracking
Cursor movement does not always perfectly represent attention, especially on mobile devices.
However, hover maps still provide useful desktop insights.
Attention Heatmaps
Understanding Attention Heatmaps
Attention heatmaps combine multiple behavioral metrics to identify engagement intensity.
They analyze:
- Scroll depth
- Mouse movement
- Time spent
- Interaction frequency
Benefits
Attention heatmaps help prioritize:
- Important content placement
- CTA optimization
- UX improvements
User Behavior Analysis Fundamentals
What Is User Behavior Analysis?
User behavior analysis involves studying how visitors interact with websites.
It helps businesses understand:
- User intentions
- Navigation patterns
- Friction points
- Conversion barriers
- Engagement behavior
Why User Behavior Analysis Matters
Understanding behavior helps businesses create better digital experiences.
Benefits include:
- Improved UX
- Higher conversion rates
- Better engagement
- Increased retention
- Reduced abandonment
Behavioral Analytics vs Traditional Analytics
Traditional analytics focus on:
- Traffic volume
- Sessions
- Bounce rates
- Acquisition channels
Behavioral analytics focus on:
- Actual user interactions
- User journeys
- Friction points
- Engagement behavior
Both approaches work best together.
Session Recordings and Replay Analysis
What Are Session Recordings?
Session recordings capture user interactions on websites.
Businesses can replay sessions to observe:
- Mouse movements
- Click behavior
- Scrolling
- Form interactions
- Navigation patterns
Benefits of Session Replay Analysis
Session recordings reveal:
- User frustration
- Navigation confusion
- Technical issues
- Form abandonment
- UX problems
Ecommerce Applications
Ecommerce businesses use recordings to analyze:
- Checkout abandonment
- Product browsing behavior
- Cart interactions
- Mobile usability issues
Popular Session Recording Tools
Hotjar
Microsoft Clarity
FullStory
Heatmaps for Ecommerce Stores
Importance of Behavioral Analytics in Ecommerce
Ecommerce stores contain multiple interaction points.
Examples include:
- Navigation menus
- Product pages
- Filters
- Search bars
- Checkout forms
Heatmaps help optimize each step of the customer journey.
Product Page Optimization
Heatmaps reveal:
- Which product images attract clicks
- Whether users interact with reviews
- CTA visibility issues
- Scroll engagement patterns
Checkout Optimization
Behavior analysis identifies checkout friction.
Businesses can detect:
- Form abandonment
- Payment confusion
- Mobile usability problems
- Error frustrations
Category Page Analysis
Heatmaps improve:
- Filter usability
- Product placement
- Navigation structures
- Search interactions
Heatmaps for Landing Page Optimization
Improving Conversion Rates
Landing pages focus on specific conversion goals.
Heatmaps help optimize:
- CTA placement
- Content hierarchy
- Form design
- Scroll engagement
Identifying Distractions
Users may focus on unimportant elements instead of CTAs.
Heatmaps help businesses reduce distractions.
Testing Different Layouts
Behavioral data helps validate landing page design decisions.
Mobile User Behavior Analysis
Why Mobile Analysis Matters
Mobile traffic dominates modern web usage.
Mobile users behave differently from desktop users.
Mobile Heatmap Challenges
Mobile interactions involve:
- Taps
- Swipes
- Gestures
- Smaller screens
Mobile Optimization Insights
Behavioral analysis reveals:
- Thumb-friendly design issues
- Mobile navigation problems
- Scroll engagement patterns
- CTA accessibility
Improving Mobile UX
Businesses can optimize:
- Sticky CTAs
- Mobile menus
- Checkout forms
- Product galleries
Form Analytics and Optimization
Importance of Form Analysis
Forms are critical for:
- Lead generation
- Ecommerce checkout
- Newsletter signups
- User registrations
What Form Analytics Measure
Behavioral tools track:
- Field abandonment
- Time spent
- Error frequency
- Interaction patterns
Common Form Problems
Examples include:
- Too many fields
- Confusing labels
- Poor mobile usability
- Validation issues
Form Optimization Strategies
Reduce Friction
Minimize unnecessary fields.
Improve Mobile Usability
Use larger inputs and autofill.
Simplify Error Messages
Clear feedback improves completion rates.
Conversion Rate Optimization Using Heatmaps
Understanding CRO
Conversion Rate Optimization improves the percentage of users completing desired actions.
Examples include:
- Purchases
- Signups
- Downloads
- Form submissions
How Heatmaps Improve CRO
Heatmaps identify:
- CTA visibility issues
- Navigation confusion
- User distractions
- Abandonment points
Common CRO Improvements
CTA Optimization
Move CTAs into high-attention areas.
Content Prioritization
Place important content above drop-off points.
Simplified Layouts
Reduce clutter and distractions.
User Journey Mapping
What Is User Journey Mapping?
User journey mapping visualizes how visitors move through websites.
It helps businesses understand:
- Entry points
- Navigation paths
- Conversion funnels
- Exit behavior
Benefits of Journey Analysis
Businesses can:
- Improve funnel performance
- Reduce abandonment
- Optimize navigation
- Enhance user experiences
Behavioral Segmentation
Understanding User Segments
Different users behave differently.
Behavioral segmentation analyzes interactions based on:
- Device type
- Traffic source
- Geography
- New vs returning visitors
Benefits of Segmentation
Segmentation helps businesse